step_spline_nonnegative() creates a specification of a recipe step that
creates non-negative spline features.
Usage
step_spline_nonnegative(
  recipe,
  ...,
  role = "predictor",
  trained = FALSE,
  deg_free = 10,
  degree = 3,
  complete_set = FALSE,
  options = NULL,
  keep_original_cols = FALSE,
  results = NULL,
  skip = FALSE,
  id = rand_id("spline_nonnegative")
)
Arguments
- recipe
A recipe object. The step will be added to the sequence of operations for this recipe.
- ...
One or more selector functions to choose variables for this step. See
selections()for more details.- role
For model terms created by this step, what analysis role should they be assigned? By default, the new columns created by this step from the original variables will be used as predictors in a model.
- trained
A logical to indicate if the quantities for preprocessing have been estimated.
- deg_free
The degrees of freedom for the b-spline. As the degrees of freedom for a b-spline increase, more flexible and complex curves can be generated.
- degree
A nonnegative integer specifying the degree of the piecewise polynomial. The default value is 3 for cubic splines. Zero degree is allowed for piecewise constant basis functions.
- complete_set
If
TRUE, the complete basis matrix will be returned. Otherwise, the first basis will be excluded from the output. This maps to theinterceptargument of the corresponding function from the splines2 package and has the same default value.- options
A list of options for
splines2::mSpline()which should not includex,df,degree, orintercept.- keep_original_cols
A logical to keep the original variables in the output. Defaults to
FALSE.- results
A list of objects created once the step has been trained.
- skip
A logical. Should the step be skipped when the recipe is baked by
bake()? While all operations are baked whenprep()is run, some operations may not be able to be conducted on new data (e.g. processing the outcome variable(s)). Care should be taken when usingskip = TRUEas it may affect the computations for subsequent operations.- id
A character string that is unique to this step to identify it.
Details
Spline transformations take a numeric column and create multiple features that, when used in a model, can estimate nonlinear trends between the column and some outcome. The degrees of freedom determines how many new features are added to the data.
This function generates M-splines (Curry, and Schoenberg 1988) which are non-negative and have interesting statistical properties (such as integrating to one). A zero-degree M-spline generates box/step functions while a first degree basis function is triangular.
Setting periodic = TRUE in the list passed to options, a periodic version
of the spline is used.
If the spline expansion fails for a selected column, the step will remove
that column's results (but will retain the original data). Use the tidy()
method to determine which columns were used.
Tidying
When you tidy() this step, a tibble is returned with
columns terms and id:
- terms
character, the selectors or variables selected
- id
character, id of this step
Tuning Parameters
This step has 2 tuning parameters:
deg_free: Spline Degrees of Freedom (type: integer, default: 10)degree: Polynomial Degree (type: integer, default: 3)
References
Curry, H.B., Schoenberg, I.J. (1988). On Polya Frequency Functions IV: The Fundamental Spline Functions and their Limits. In: de Boor, C. (eds) I. J. Schoenberg Selected Papers. Contemporary Mathematicians. Birkhäuser, Boston, MA
Ramsay, J. O. "Monotone Regression Splines in Action." Statistical Science, vol. 3, no. 4, 1988, pp. 425–41
Examples
library(tidyr)
library(dplyr)

library(ggplot2)
data(ames, package = "modeldata")

spline_rec <- recipe(Sale_Price ~ Longitude, data = ames) |>
  step_spline_nonnegative(Longitude, deg_free = 6, keep_original_cols = TRUE) |>
  prep()

tidy(spline_rec, number = 1)
#> # A tibble: 1 × 2
#>   terms     id
#>   <chr>     <chr>
#> 1 Longitude spline_nonnegative_KVV9Z

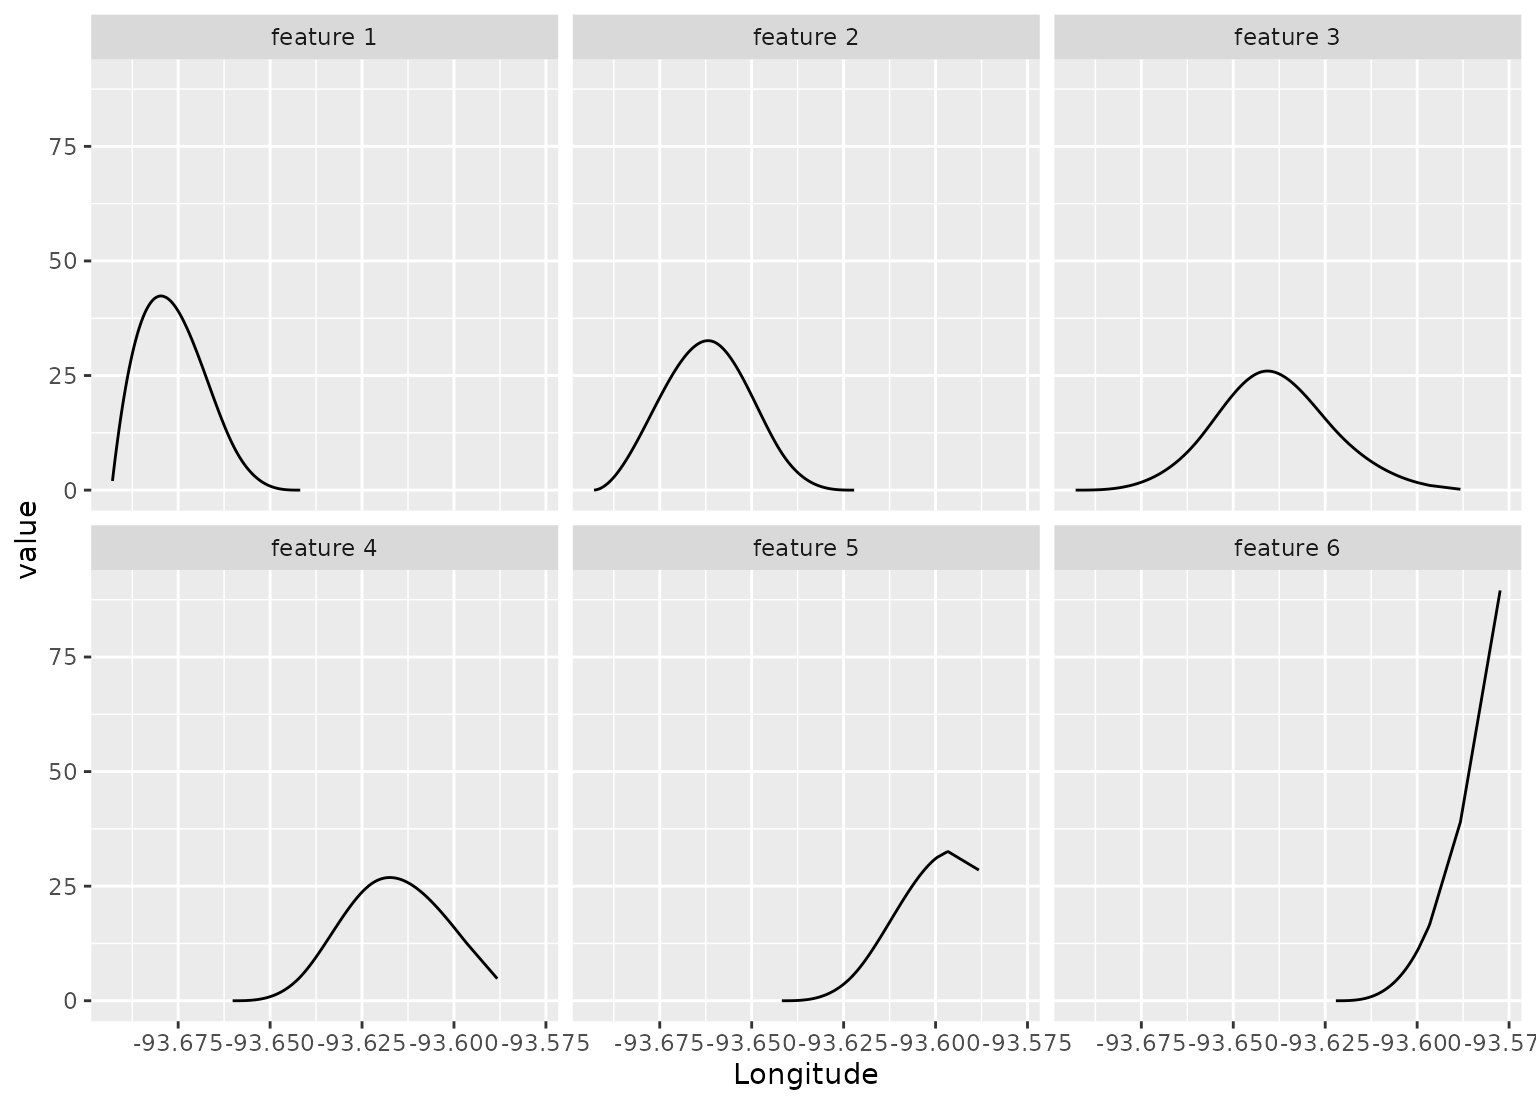
# Show where each feature is active
spline_rec |>
  bake(new_data =  NULL,-Sale_Price) |>
  pivot_longer(c(starts_with("Longitude_")), names_to = "feature", values_to = "value") |>
  mutate(feature = gsub("Longitude_", "feature ", feature)) |>
  filter(value > 0) |>
  ggplot(aes(x = Longitude, y = value)) +
  geom_line() +
  facet_wrap(~ feature)

